The Executive Dashboard began as a one-off project that allowed Intel executives to quickly assess the effectiveness of current marketing campaigns across the twittersphere. Client admins are now able to quickly create any number of custom dashboards, each consisting of tabbed dataviews that present easy-to-digest social business intelligence in a number of customizable ways.
The views
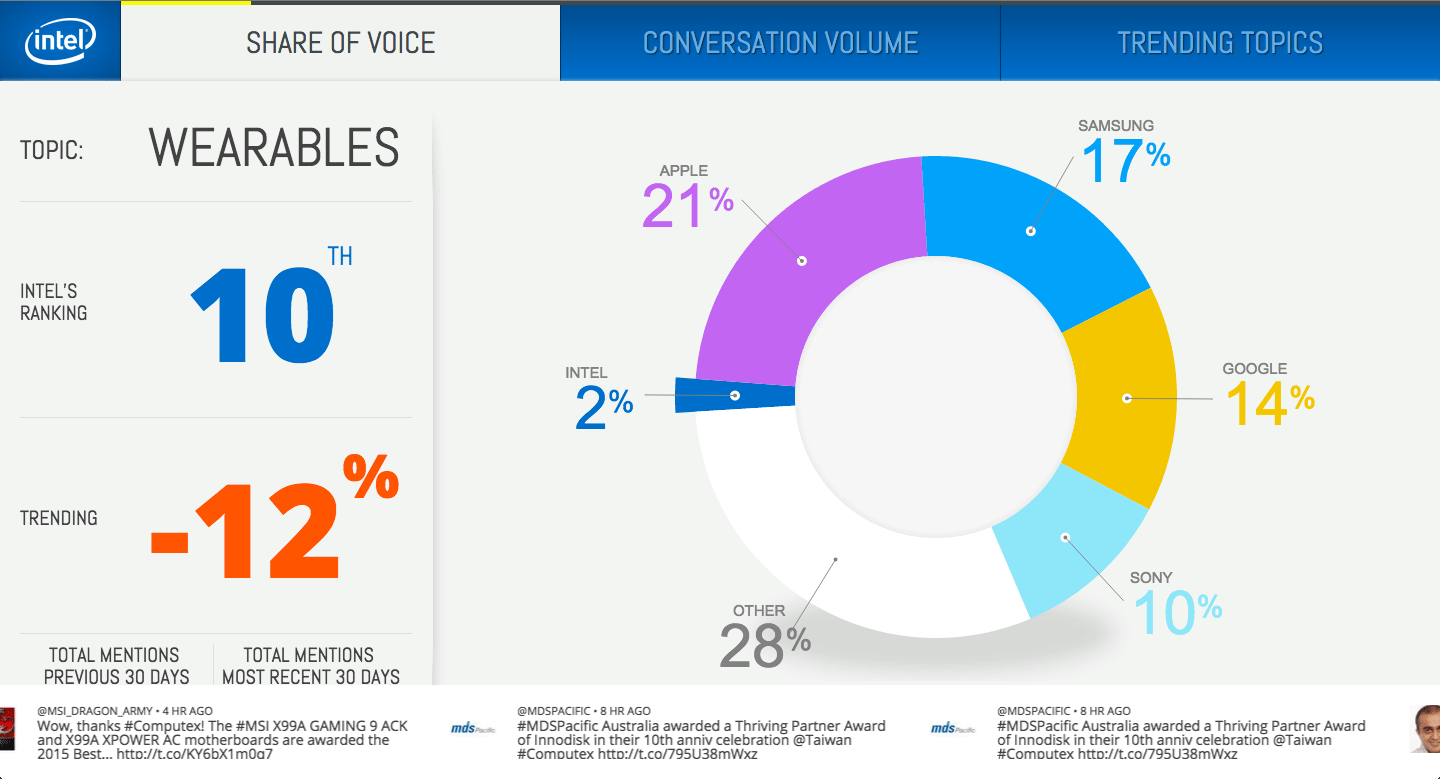
We currently have three dataviews: Share of Voice, Conversation Volume, and Trending Topics.
Share of Voice tallies the brands causing the biggest stir on twitter across a range of user-specified hashtags and renders a donut chart showing percentages.
Conversation Volume renders a scrolling line graph showing total twitter mentions of a client’s brand and includes a summary of positive/negative sentiment over client-specified time segments.
Trending Topics yields a scrolling view of topic cards with information on how that volume has changed over the past year.
Client abstraction
After quickly custom-building the application for Intel, we abstracted the codebase and created the current Executive Dashboard software product to suit the needs of any client. We chose Laravel 5 to drive the back-end. The framework handles routing, MVC architecture, admin functionality, and the fetching/packaging/caching of twitter data via WCG’s customsearch API.
Lead the front-end
I did back-end Laravel work at the onset, but became primarily responsible for building the ES6/Babel front-end to consume the JSON from the API as the project wore on. I created a general class to handle dataview tab timing/switching including the syncing of the LESS-driven progress bar at top.
This class was also responsible for instantiating specific dataview classes. Each dataview was broken up into three parts. The first class derives all statistical calculations needed for output. The second class packages those calculations in a way to ease ingestion of the third part. This last part renders the data using a combination of D3 and jQuery.